Norse Subscriptions help
Analytics: what the numbers mean
Read recurring revenue, who stays and who leaves, what is due in the next 90 days, and how many choose a subscription.
This article explains the figures and tabs on Analytics, in the app's menu. The page answers three questions: what comes in, who stays, and what is ahead.
It reads the subscriptions and payments the app already keeps. How these numbers are worked out, at the foot of the page, explains each figure.
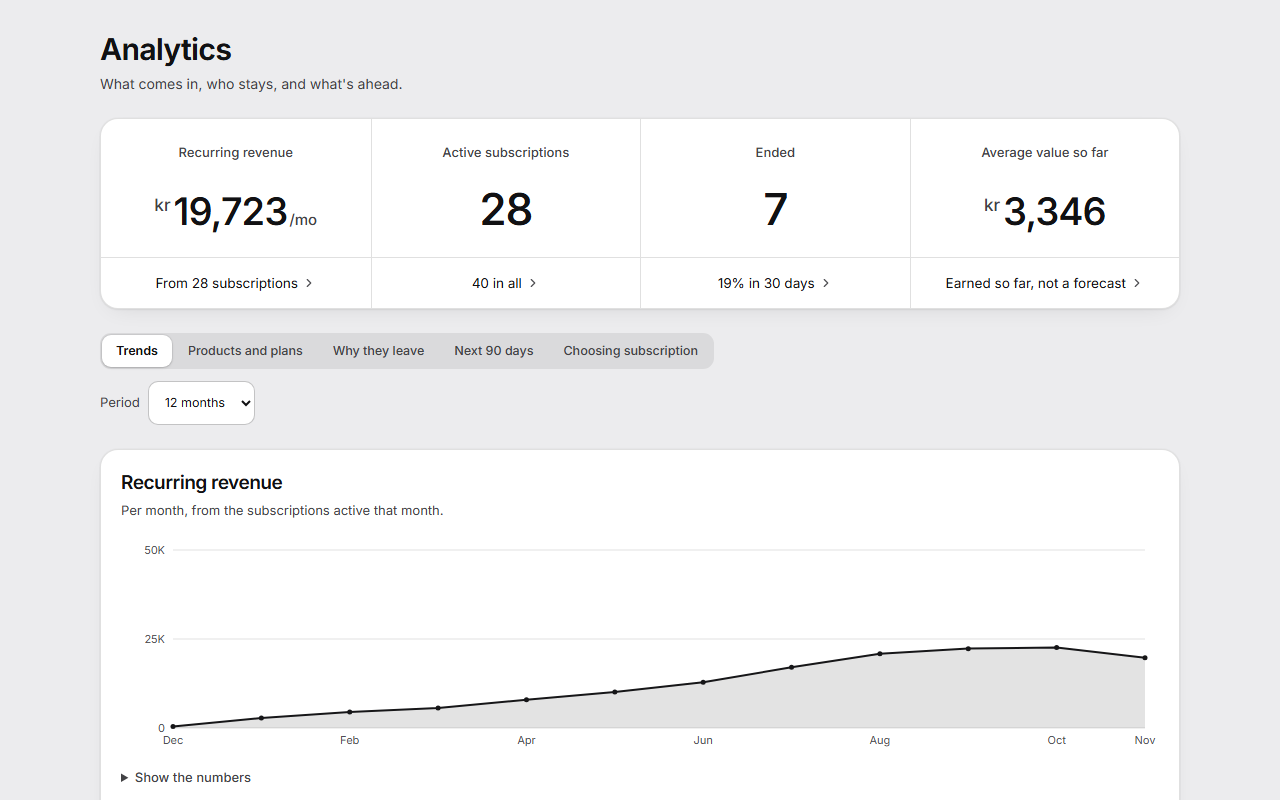
The four figures at the top
The figures at the top are always for today. The line under each one leads on to where it comes from.
- Recurring revenue: the monthly price of every active subscription with a captured price, shown per month. A subscription without a captured price is left out, never counted as zero.
- Active subscriptions: a subscription counts from the day it started until it ended. A paused one counts until it ends.
- Ended: how many of the subscriptions active 30 days ago have ended since.
- Average value so far: each subscription's monthly price times the months it has been active. It is money already earned, not a forecast. It shows once it comes to one whole unit of your currency.
Choose a tab
Under What to look at, choose a tab. The tab you choose is in the page's address, so a bookmark opens it.
- Trends: recurring revenue over time, Deliveries charged, Subscribers over time, Churn, and Who stays, with subscribers grouped by the month they started. Show the numbers shows a table under each chart.
- Products and plans: active subscriptions, churn, monthly revenue and skips for each product and plan. A subscription with two products counts under both.
- Why they leave: Stayed instead of cancelling, the reasons given when cancelling month by month, Who stayed after opening the cancel step, Skips and pauses, and Won back, per cause.
- Next 90 days: how many units are on the delivery plans in each 30 days. Download CSV gives you a file for ordering stock. It is what the plans say today, not a forecast.
- Choosing subscription: how many customers who could choose a subscription did, and which checkout links bring subscriptions.
On Trends, Products and plans and Why they leave, Period chooses 3 months, 6 months or 12 months. On Choosing subscription, it chooses Last 30 days or Last 90 days.
Count who chooses subscription
Choosing subscription has two sources side by side.
- Chose subscription, from orders: online store orders with a product sold on one of your plans, and how many of them had a plan. It needs Shopify's permission to read orders, which Shopify asks you to approve when the app is updated. Shopify lets the app read the last 60 days, so 90 days fill up as days pass.
- Chose subscription, from product pages: under Count on the product pages, press Turn on counting. A small Shopify pixel counts the product pages that show the subscription choice, and what goes in the cart from them, with a plan and without. It runs only as far as each visitor's cookie consent allows. Turn off stops it at any time.
Only numbers per day and product are kept. No customer, order, IP address or visit.
Good to know
- The four figures, Trends and Choosing subscription are in every plan. Products and plans, Why they leave and Next 90 days are in Starter, and show locked in their place on Free.
- Revenue is shown in your store's currency. When some subscriptions have no captured price or another currency, the line under Recurring revenue says how many it counts.
- Months follow your store's time zone.
- Earlier months are estimated from today's prices until the app's daily record covers them. The chart says from which month it is recorded.
- Prepaid subscriptions aren't in Next 90 days, because their plan holds the dates they pay, not the dates they ship. The page says how many to order for on top.
- Amounts use each subscription's price today plus extras on the delivery. Shopify's order holds the exact total, with shipping and tax.